Norbu app analysis
Instruments
- SQL, BigQuery, Google Cloud
- Python, Jupyter Notebook, GitHub Pages
Project’s goal
Provide recommendations to increase retention rate based on app data analysis. Data available: about 2 months of user activity logs, user ltv, geography, devices, traffic sources.
Product
Norbu is a healthcare mobile app, which provides different techniques to cope with stress: meditation, breathing, games to improve focus. The app profits from paid subscriptions, bought by users.
What does Norbu promise to the user?
Help control stress
Event funnel
Most popular exercices are: breathing and ball game. Let’s take a look at one of the exercises: the breathing exercise
8% of people do not proceed from the exercise screen to the exercise itself.
- There should be less barriers between intention to exercise and the exercise itself: more screens/clicks - more opportunities for the user to change one’s mind. Remove one screen between choosing the exercise and starting the exercise. There should be just 2 clicks: choose the exercise and start the exercise.
- 30% of users who started the breathing exercise do not finish it. Use in-app messaging as an extrinsic motivation, e.g. praise for good effort or focus on the goal (which user selected during onboarding or smth general): “One step closer to your goals” or “Thank you for taking care of oneself”. Reference
Retention
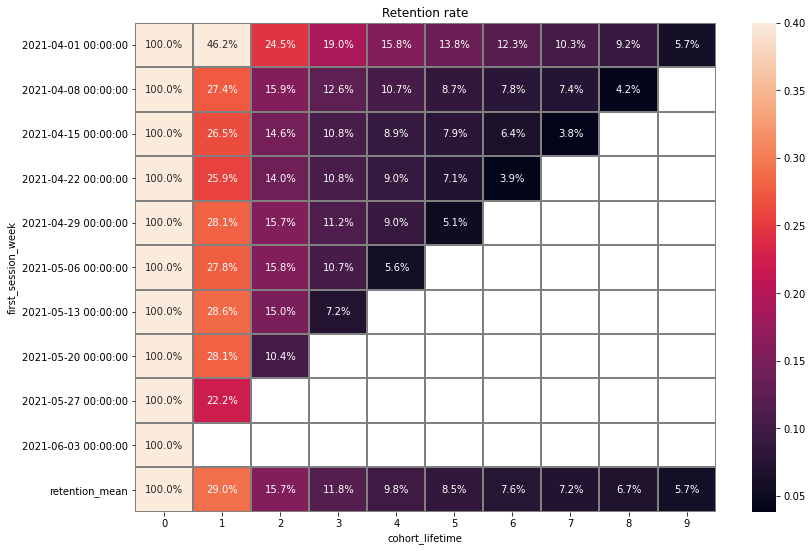
Average retention rate is pretty normal. For example, Headspace (industry leader) has average retention by day 30 around 8%. Reference
User activity
Overall number of daily events correlates with the number of daily unique users, which is good, as there are no heavy-users, whom it would be risky to lose.
App removal
- Share of users who remove the app is around 50% which corresponds to average uninstall rate in the mobile app industry Reference.
- That’s why we did not dig into reasons of app removal, as the rate is pretty normal. We would suggest to subscribe a new user to the emails by default, interesting email might attract a user, who has already removed an app.
Inactive users
We decided to consider users who haven’t used an app for more than 10 days, but haven’t uninstalled the app - to be inactive users. There are around 30% of inactive users.
Geographical distribution
Middle East and Europe are leading regions in the number of unique users.
Germany and Iran are responsible for 50% of all unique users. It happens that the Norbu app is free in Iran, which explains its popularity there.
The most active city is Tehran.
Traffic sources
There are just two significant traffic sources for now.
- Probably, it will make sense to choose another potentially successful traffic source to develop: e.g. social networks.
- Plus, improve existing sources, for example, perform Google Play Optimization (if not yet). Currently, not all relevant keywords result in finding Norbu app: searching “meditation”, “mindfulness”, “breathing” do not result in finding Norbu app, but searching “stress” or “stress control” - does.
- We would recommend to start a referral program, invites with promo codes as it could be a new channel of traffic, plus - social connection promotes retention.
OS and devices
Android OS and mobile phones are the most popular choices. It would be interesting to know why the app isn’t yet popular on iOS? Is it new or lacks some functionality?
First open/Onboarding
-
Options do not correspond to the question, recommendations or question should be reformulated: “what worries you” - “trouble falling asleep” or “what would you like to achieve” - “Improve sleep”
-
Reduce decision fatigue, simplify behavior: add default options here and on an exercise screen, e.g. “training of the day”.
Conclusion
- Retention and uninstall rate are pretty normal compared with other mobile apps. Several different strategies to improve retention are proposed above.
- We would recommend diversifying OS, traffic sources and attracting users from different countries.
- We have noticed that app navigation is a bit puzzling and there are multiple ways to get to one exercise. As event funnels show many users get lost and do not finish chosen exercises. We suggest working with a UX specialist to simplify app navigation. This will also allow us to understand when and why users are lost during the app data analysis in the future.
- We would advise to improve data collection: get more information about users (if they approve), e.g. age, gender, stress reasons.